Key Mobile App Metrics you need to track to measure app success
by Rahul Malik : Linkedin

Fact : Less than 0.02% of mobile apps are successful
You all know that developing a mobile app is only a first step in the journey of delivering a successful mobile app. In order to make your app successful, you need to measure the right metrics, iterate, A/B test and optimize to reach your target goals.
Every mobile product manager has a same question in his mind -
“What are the key mobile app metrics I should track?”
So, I am going to share a note on key mobile app metrics which my product team track and work continuosly towards improving them which are helpful in measuring mobile app success at every stage of product journey.

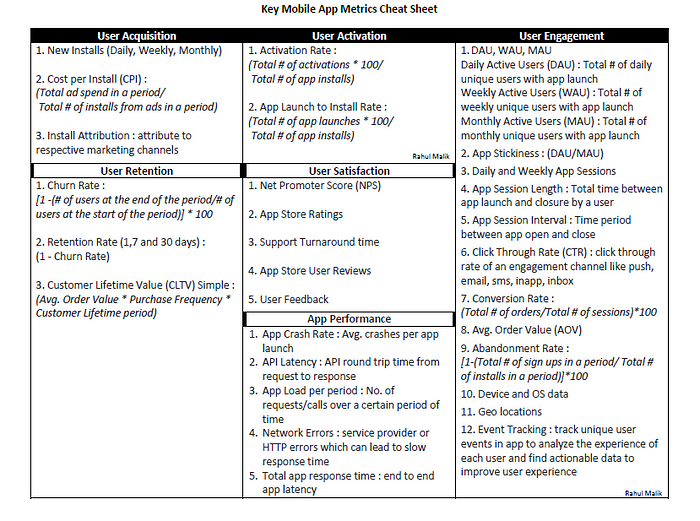
App Performance Metrics
- App Crash Rate : Avg. crashes per app launch
- API Latency : API round trip time from request to response
- App Load per period : No. of requests/calls over a certain period of time
- Network Errors : service provider or HTTP errors which can lead to slow response time
- Total app response time : end to end app latency
User Acquisition Metrics
6. New Installs (Daily, Weekly, Monthly)
7. Cost per Install (CPI) :
(Total ad spend in a period/Total # of installs from ads in a period)
8. Install Attribution : attribute to respective marketing channels
User Activation Metrics
9. Activation Rate :
(Total # of activations/ Total # of app installs)*100
10. App Launch to Install Rate :
(Total # of app launches/Total # of app installs)*100
User Engagement Metrics
11. DAU, WAU, MAU
Daily Active Users (DAU) : Total # of daily unique users with app launch
Weekly Active Users (WAU) : Total # of weekly unique users with app launch
Monthly Active Users (MAU) : Total # of monthly unique users with app launch
12. App Stickiness : (DAU/MAU)
13. Daily and Weekly App Sessions
14. App Session Length : Total time between app launch and closure by a user
15. App Session Interval : Time period between app open and close
16. Click Through Rate (CTR) : click through rate of an engagement channel like push, email, sms, inapp etc.
17. Conversion Rate :
(Total # of orders/Total # of sessions)*100
18. Avg. Order Value (AOV)
19. Abandonment Rate :
[1-(Total # of sign ups in a period/ Total # of installs in a period)]*100
20. Device and OS data
21. Geo locations
22. Event Tracking : track unique user events in app to analyse the experience of each user and find actionable data to improve user experience
User Retention Metrics
23. Churn Rate :
[1 -(# of users at the end of the period/# of users at the start of the period)]*100
24. Retention Rate (1,7 and 30 days) : (1-Churn Rate)
25. Customer Lifetime Value (CLTV) Simple :
(Avg. Order Value * Purchase Frequency * Customer Lifetime period)
User Satisfaction Metrics
26. Net Promoter Score (NPS)
27. App Store Ratings
28. Support Turnaround time
29. App Store User Reviews
30. User Feedback
There can be other metrics which are relevant to your line of business which should be tracked along with the metrics mentioned above. Measure your app success and take daily actions to improve these metrics.
Please create metric dashboards to track and share feedback. Feel free to comment other mobile app metrics you are currently tracking for your product.
Thanks for reading :)
#DOSHARE
#mobile #mobileapp #metrics #productmanagement #productmanager #b2c #product #customerexperience #customerobsession #performance #acquisition #activation #engagement #retention #engineering #design #marketing #startups #amazon #flipkart #zomato #swiggy #olacabs #uber
Read Similar Stories:
Strategy in Turbulent Times of COVID
BACER -Product Prioritisation Framework for B2B products
How to increase revenue by using versioning strategy to design a software product line
Product Manager interview guide for Leaders
Social Commerce in India : Market & Product Study
Electric Scooter/Bike : Market & Product Study
How to use versioning strategy to design a software product line
